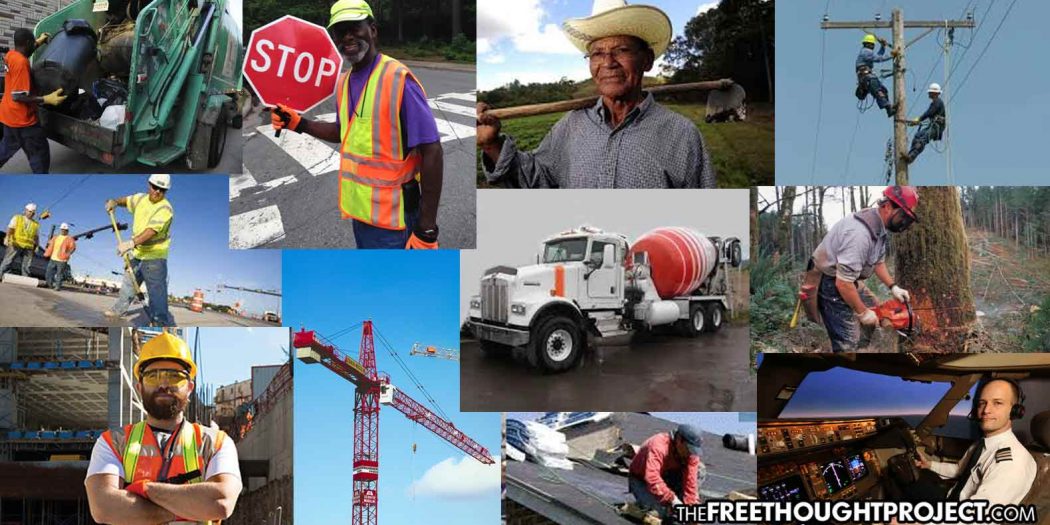
Bureau of Labor Releases Top 20 Most Dangerous Jobs
—
Cops Aren’t on the List
By Matt Agorist, November 2020
Every single day, we are constantly reminded via politicians, television, and the mainstream media in general of just how brave those “boys in blue” are to work in such “dangerous” conditions. The thin blue line, we’re told, is akin to storming the beaches at Normandy.
But do these claims of mass danger and death hold water? Is it really necessary to dump 12 rounds into an unarmed autistic 13-year-old, so you can “make it home to your wife and kids”?
Over the last two decades police departments across the country have been steadily increasing their firepower, while their jobs have actually gotten LESS dangerous.
A report put out at the beginning of the year by the National Law Enforcement Officers Memorial Fund, highlights that lack of danger by showing a decrease in police officer deaths this year and a downward trend year over year.
Other jobs, however, appear to be getting more dangerous. The latest data from the Bureau of Labor Statistics (BLS), recorded a preliminary total of 5,250 fatal work injuries in the US in 2018 which is a jump from 4,821 in 2014. The BLS compiled that data to make a chart of the top 25 most dangerous jobs. Guess who’s not in the top twenty.
20. Heavy vehicle mechanics
BLS Category: Heavy vehicle and mobile equipment service technicians and mechanics
Fatal injury rate: 14 per 100,000 workers
Total deaths (2018): 27
19. Supervisors of mechanics
BLS Category: First-line supervisors of mechanics, installers, and repairers
Fatal injury rate: 15 per 100,000 workers
Total deaths (2018): 46
Salary: $70,550
Most common fatal accidents: Violence and other injuries by persons or animals
18. Small engine mechanics
Fatal injury rate: 15 per 100,000 workers
Total deaths (2018): 8
Salary: $37,840
Most common fatal accidents: Transportation incidents, violence and other injuries by persons or animals
17. Cement masons
BLS Category: Cement masons, concrete finishers, and terrazzo workers
Fatal injury rate: 17 per 100,000 workers
Total deaths (2018): 11
Salary: $48,330
Most common fatal accidents: Falls, slips, trips
16. Highway maintenance workers
Fatal injury rate: 18 per 100,000 workers
Total deaths (2018): 14
Salary: $42,410
Most common fatal accidents: Transportation incidents
15. Landscaping supervisors
BLS Category: First-line supervisors of landscaping, lawn service, and groundskeeping workers
Fatal injury rate: 18 per 100,000 workers
Total deaths (2018): 48
Salary: $52,340
Most common fatal accidents: Falls, slips, trips
14. Construction helpers
BLS Category: Helpers, construction trades
Fatal injury rate: 18 per 100,000 workers
Total deaths (2018): 11
Salary: $31,830
Most common fatal accidents: Falls, slips, trips
13. Crane operators
BLS Category: Crane and tower operators
Fatal injury rate: 19 per 100,000 workers
Total deaths (2018): 9
Salary: $60,530
Most common fatal accidents: Transportation incidents, Contact with objects and equipment
12. Crossing guards
Fatal injury rate: 19 per 100,000 workers
Total deaths (2018): 14
Salary: $29,760
Most common fatal accidents: Transportation incidents
11. Agricultural workers
BLS Category: Miscellaneous agricultural workers
Fatal injury rate: 20 per 100,000 workers
Total deaths (2018): 157
Salary: $25,840
Most common fatal accidents: Transportation incidents
10. Power linemen
BLS Category: Electrical power-line installers and repairers
Fatal injury rate: 20 per 100,000 workers
Total deaths (2018): 29
Salary: $71,960
Most common fatal accidents: Exposure to harmful substances or environments
9. Firefighting supervisors
BLS Category: First-line supervisors of fire fighting and prevention workers
Fatal injury rate: 20 per 100,000 workers
Total deaths (2018): 14
Salary: $82,010
Most common fatal accidents: Transportation incidents
8. Farmers
BLS Category: Farmers, ranchers, and other agricultural managers
Fatal injury rate: 26 per 100,000 workers
Total deaths (2018): 257
Salary: $71,160
Most common fatal accidents: Transportation incidents
7. Delivery drivers
BLS Category: Driver/sales workers and truck drivers
Fatal injury rate: 27 per 100,000 workers
Total deaths (2018): 966
Salary: $29,610
Most common fatal accidents: Transportation incidents
6. Ironworkers
BLS Category: Structural iron and steel workers
Fatal injury rate: 29 per 100,000 workers
Total deaths (2018): 15
Salary: $53,650
Most common fatal accidents: Falls, slips, trips
5. Garbage collectors
BLS Category: Refuse and recyclable material collectors
Fatal injury rate: 34 per 100,000 workers
Total deaths (2018): 37
Salary: $42,100
Most common fatal accidents: Transportation incidents
4. Roofers
Fatal injury rate: 41 per 100,000 workers
Total deaths (2018): 96
Salary: $42,100
Most common fatal accidents: Falls, slips, trips
3. Derrick operators in oil, gas, and mining
BLS Category: Derrick, rotary drill, and service unit operators, oil, gas, and mining
Fatal injury rate: 46 per 100,000 workers
Total deaths (2018): 20
Salary: $51,390
Most common fatal accidents: Transportation incidents, contact with objects and equipment
2. Aircraft pilots and flight engineers
Fatal injury rate: 53 per 100,000 workers
Total deaths (2018): 70
Salary: $121,430
Most common fatal accidents: Transportation incidents
1. Logging workers
Fatal injury rate: 111 per 100,000 workers
Total deaths (2018): 56
Salary: $41,230
Most common fatal accidents: Contact with objects and equipment
Fatal work injuries among law enforcement were actually down 14 percent compared to last year and according to the most recent rankings, Police Officers come in at the 22nd most dangerous jobs.
About Matt Agorist:
Come Follow Us on Twitter – Come Like Us on Facebook
Check us out on Instagram – And Sign Up for our Newsletter


 thefreethoughtproject.com


